
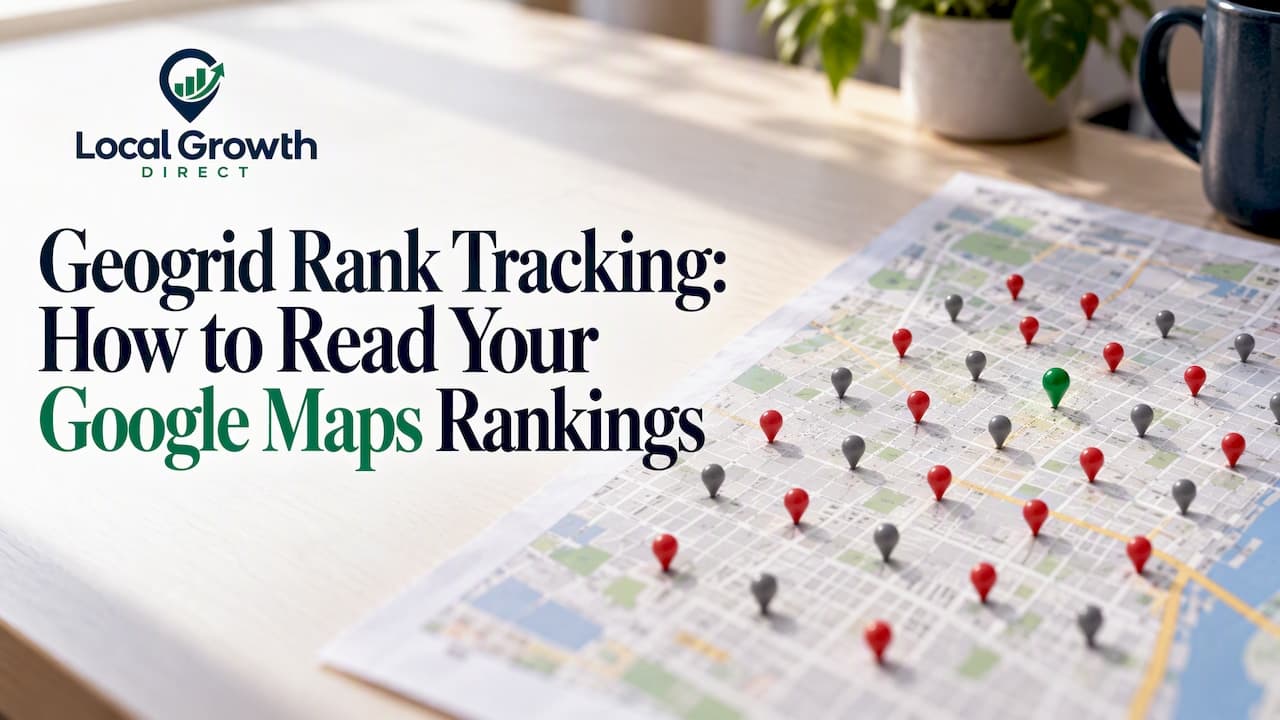
Geogrid rank tracking checks your Google Maps position from many points around your business, not just one, and plots each result on a map. The map shows where you win calls, where you fade out and which competitor owns the blocks you are missing. For a service business, that is far more useful than a single "I rank #2" number, because that number only holds for the spot where someone happened to check.
Below: how a grid works, how to set one up, how to read the colors and averages, how often to scan, and what to do with the weak zones you find.
TL;DR
- A geo-grid runs the same Google Maps search from a grid of points (commonly 3x3, 5x5 or 7x7) and records your rank at each one.
- Rankings change by location because Google weighs relevance, distance and prominence, and distance depends on where the searcher stands.
- Read coverage (how many points land in the top 3 or top 10) before you read any average rank, because averages can hide big blank areas.
- Keep keyword, grid size, spacing and center identical between scans, or you cannot compare them.
- A heat map shows where you are weak. Fixing it still means work on your Google Business Profile, reviews, website and citations.
Table of Contents
- What geogrid rank tracking actually measures
- Why your ranking changes from block to block
- How to set up a geo-grid scan
- Reading the map: colors, coverage and averages
- Patterns that point to specific problems
- How often to scan, and what should trigger a new one
- Turning a weak zone into work
- Our perspective: a grid is a scoreboard, not a strategy
- Want us to run the scan and fix what it finds?
- Common mistakes with geogrid tracking
- FAQ
- Sources
What geogrid rank tracking actually measures
A geo-grid runs the same local search from multiple points around a business and records where the listing appears at each point. Imagine a 7x7 square laid over your city with your office in the middle. A tool searches "AC repair" as if from each of the 49 points and notes whether you are first, fifth or nowhere.
The result is usually shown as a map of colored pins with a number on each. Green generally means you are in the top results at that point. Red or gray means you are far down or absent.
This matters because there is no such thing as "your" Maps ranking. Your ranking is a set of rankings, one per searcher location.

Why your ranking changes from block to block
Google's own guidance says local results are mainly based on relevance, distance and prominence. Relevance is how well your profile matches the search. Prominence is how well known you are, which reviews, links and general web presence feed into. Distance is how far your business is from the person searching.

That third factor is the reason a grid looks the way it does. A homeowner two miles north of your shop sees a different set of results than one two miles south, even with an identical query. Your competitor on the south side gets the benefit of proximity there. You get it near your own address.
Geography also changes how hard the job is. One experiment from a rank tracking build-your-own guide reported that ten businesses showed up at 21% of grid points in New York but 68% of points in Boise. Dense markets spread visibility thin. Smaller metros leave more room. Judge your own map against your own market, not a screenshot from another city.
How to set up a geo-grid scan
Most tools ask for the same few inputs. Getting them right matters more than which tool you use.
- Pick the exact listing. Use the business listing itself, not just the name. If you have multiple locations, scan each one separately.
- Choose the center. For a storefront, use your address. For a service-area business that hides its address, center the grid on the area where you actually want calls, and read results with that in mind. Our guide to service area business SEO covers how those profiles behave in Maps.
- Choose keywords customers type. Use "furnace repair near me" style phrasing, not your internal service names. Start with two or three: your main money term, an emergency term and one specific service.
- Pick the grid size. Odd numbers (3x3, 5x5, 7x7 and up) put a point directly over the center. Bigger grids give finer detail and more data points. A 5x5 is a sensible start for a single-city business, and a 7x7 suits a wider service area.
- Set the spacing or radius. Wider spacing covers more territory. Tighter spacing shows detail around your immediate neighborhood. Match the radius to how far you will actually drive for a job. A grid that extends 25 miles when you serve 10 will paint a depressing, irrelevant picture.
- Drop pointless points. Lakes, industrial parks and empty fields do not produce customers. If your tool lets you skip points, skip them.
- Write down the settings. You will need them for the next scan.
Reading the map: colors, coverage and averages
Start with the legend. Color meanings are not standard. One tool may call positions 1 to 3 green, 4 to 10 yellow and 11 or lower red. Another may use five or six bands, with gray for "not in the top 20." A red pin in one product can be an orange pin in another. Never compare screenshots from different tools without checking their legends.
Then look at these numbers, in this order.
| Metric | What it tells you | Watch out for |
|---|---|---|
| Top 3 coverage | Share of points where you are in the Map Pack-style top three | The number closest to phone calls |
| Top 10 coverage | Share of points where you are at least visible | Position 8 still loses most clicks to the top three |
| Average rank (where found) | Average position across points where you appeared | Ignores points where you are missing, so it can look flattering |
| Average rank (all points) | Same, but missing points count as a poor fixed value, often 21 | Better picture of true visibility, but the penalty value is a tool choice |
The trap is the first kind of average. Imagine you rank #2 at 6 points and appear nowhere at the other 43. A "found only" average of 2.0 sounds fantastic. The map would be nearly empty. That is why we tell clients to read coverage first and treat averages as supporting detail.
Gray points and blank spots
Gray can mean you are not on the first page, or it can mean the lookup failed. Some tools also interpolate cells rather than scanning them, and some skip water. If one pin looks odd in an otherwise clean area, rescan before you draw any conclusion.
Patterns that point to specific problems
A heat map is a diagnostic, not proof of a cause. Treat each pattern as a hypothesis, then test it with a follow-up scan after you change something.
- Strong at the center, fading in every direction. Normal for a business whose strength is mostly proximity. Prominence work (reviews, citations, links) is what extends the green outward.
- Strong in one direction, weak in the other. Look for a competitor clustered on the weak side. Check their review count, categories and how many service pages they have for that area.
- Green in the city but weak in neighboring towns. Your website probably lacks pages and proof for those towns. Service-area pages with real jobs, photos and local detail help.
- Patchy with random holes. Could be noise or a failed lookup. Rescan before acting.
- Weak for one keyword, strong for another. A relevance problem: category, services list, or page content that does not match the weaker term.
How often to scan, and what should trigger a new one
Weekly is a common default in rank tracking products, and it is a reasonable cadence for most service businesses. Daily scans mostly add noise. Local results shift for ordinary reasons, and one tool vendor advises leaving at least 72 hours between scans to reduce the effect of cached points.
Outside the schedule, run a fresh scan when:
- you change your primary category, services or business name on your profile;
- you add a batch of reviews or finish a review campaign;
- you launch new service-area pages;
- you move, add a location or change your service area;
- a competitor opens nearby or you see calls drop.
One rule above all: keep keyword, grid size, spacing and center constant between scans. Change two things and you cannot say which one moved the map.
Turning a weak zone into work
Google states plainly that you cannot request or pay for a better local ranking. What you can do is make the profile verified, complete and accurate: address where customers can visit, hours, category and attributes, plus photos and review responses. Verification also helps locations appear across Google products, including Maps and Search. Grid data tells you where to point that effort.
A practical order of operations:
- Fix the profile basics first. Primary category, secondary categories, services, hours and service areas. If you have not done this carefully, our 90-day Google Business Profile plan lays out the sequence. If you are starting from nothing, begin with how to set up a Google Business Profile.
- Build reviews that mention the service and the area. Prominence drives how far your green spreads. Steady review flow beats a one-time burst.
- Clean up citations. Inconsistent name, address or phone data across directories undercuts trust. See our guide to local citations for service businesses.
- Create pages for the weak areas. One thin "areas we serve" list rarely helps. A page per important city with real project detail does more.
- Rescan after four to six weeks of work, using identical settings, and compare coverage, not just the average.
Some owners cover a stubborn gap with paid search while the organic work takes hold. If you go that route, a combined Google Ads and SEO approach keeps the two efforts from working against each other.
The same logic applies by trade. A roofer's map, with storm-driven demand and wide territories, looks different from a med spa's. Our notes on local SEO for roofers and Google Maps SEO in the map pack show how we adapt.
Our perspective: a grid is a scoreboard, not a strategy
We work only with local service businesses, and the most common mistake we see is owners treating a green map as the goal. The goal is booked jobs. A grid is a fair scoreboard for visibility, and we use it that way.
Three things we hold to:
- Coverage beats averages. We report top 3 and top 10 coverage first, because an owner cannot answer a phone with an average.
- Scan where you work. We set the grid radius to the real drive-time of the crew. A map that includes areas you will never serve produces false alarms and wasted effort.
- Pair the map with calls. If the grid improves and calls from the profile do not, something else is wrong: the offer, the phone handling, the reviews or the website. Our Google Maps lead playbook covers tracking that end of the funnel.
Most businesses we talk to have a decent website but a weak profile, and the grid makes that obvious within one scan. The fix is rarely a trick. It is steady, hands-on work on the profile, reviews and local relevance, done consistently, and then measured again with the same settings.
— John
Want us to run the scan and fix what it finds?
If you would rather not learn another tool, we handle it for you. Our Google Business Profile management, review and reputation work, and Google Maps visibility tracking cover the scans, the competitor comparison and the profile and review work that moves the map. You do not have to manage new platforms yourself.

A good first step is a personal local SEO audit, which shows where you stand before you commit to anything.
Common mistakes with geogrid tracking
- Comparing scans with different settings. A new keyword or a wider radius makes the maps incomparable.
- Scanning too often. Day-to-day wiggles are not trends. Look at four-week movement.
- Chasing green in places you do not serve. Effort belongs where jobs are profitable.
- Ignoring the competitor view. Knowing who holds your weak zones tells you what to study: reviews, categories, photos, pages.
- Declaring victory on the average. Always check how many points are missing entirely.
- Expecting instant results. Reviews, citations and content take weeks to show up on the map.
FAQ
What is geogrid rank tracking?
It is a way of checking your Google Maps position from many points around your business instead of one. A tool runs the same search at each point of a grid, such as 5x5, and plots your rank on a map. The pattern shows where you are visible and where competitors take over.
What grid size should I use?
A 5x5 grid is a good start for a business serving one city, and a 7x7 suits a wider service area. Larger grids give finer detail but cost more scans. Set the spacing to match how far you will actually travel for jobs, then keep it fixed.
How often should I run a scan?
Weekly is a sensible default for most service businesses. Leave at least a few days between scans of the same grid, and run an extra one after a major change such as a new primary category, a review push or new service-area pages.
Why does my average rank look good when I get few calls?
Many tools average only the points where you appeared, so large blank areas never count against you. Check top 3 and top 10 coverage, and use an average that penalizes missing points. Coverage is much closer to how many people actually see you.
Can I pay Google to rank better on the map?
No. Google says you cannot request or pay for a better local ranking in its local ranking guidance. Paid ads are a separate placement. Organic map position comes from relevance, distance and prominence.
Sources
- Tips to improve your local ranking on Google, Google Business Profile Help
- Geo-grid rank tracking glossary
- Build Your Own Geo-Grid Local Rank Tracker, HasData